
Imagine we are part of the Data team at a software company that released a new tool one year ago and now wants to understand whether customers are adopting it—and who those customers are. Using SQL and Python together, we can answer several key business questions.
We will work with three tables: Users (containing information such as age, professional status, country, and gender), Plan (indicating whether a user has a free, basic, or premium subscription), and New Feature Adoption (with the dates of each user’s first and last use of the new tool).
Disclaimer: The database used in this project is entirely synthetic and was created solely for educational and demonstration purposes.
To combine SQL and Python effectively, we will import an additional library—alongside our familiar Pandas, NumPy, and Matplotlib:

SQLAlchemy is a Python library that provides tools to connect to databases, run SQL queries, insert data, and manage tables using either raw SQL or a higher-level ORM interface.
The command create_engine creates an in-memory SQLite database engine that exists only while your Python session is running.
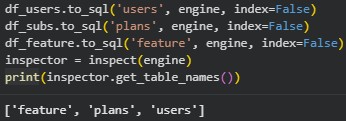
To.sql() writes the pandas DataFrames into the database connected through engine, creating tables names ‘feature’, ‘plans’ and ‘users’, without adding the DataFrame index as a column.
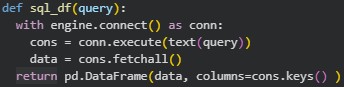
This function, sql_df(query), allow us to run a SQL query directly on the database connected through engine and receive the results as a pandas DataFrame. It opens a temporary connection, executes the SQL query using conn.execute(text(query)), fetches all returned rows, and then builds a DataFrame where the data is stored in rows and the column names come from the SQL result. This makes it easy to use SQL inside Python and continue analyzing the output with pandas.
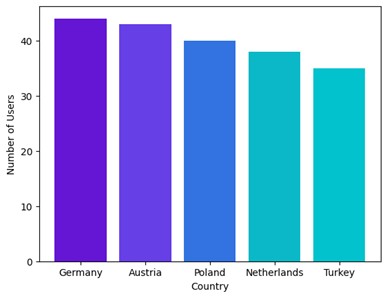
Number of Users per Country
To find the number of users in each country, we can simply write a SQL query just as we would in any database:

The advantage of combining SQL with Python is that we can use SQL’s flexible and intuitive query structure to extract exactly the data we need, and then leverage Python’s visualization libraries, such as matplotlib, to present those results in a clear and compelling way:
Comparing Feature Adoption Rates by Country
Let’s say we want to compare the percentage of users from each country that adopted the new feature:
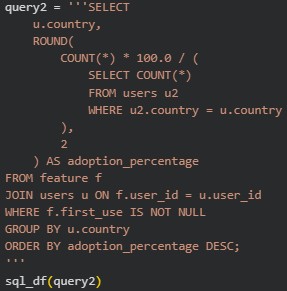
With the results from this query we can create a visual representation:

Understanding User Engagement: Professional Adoption and Single-Use Behavior
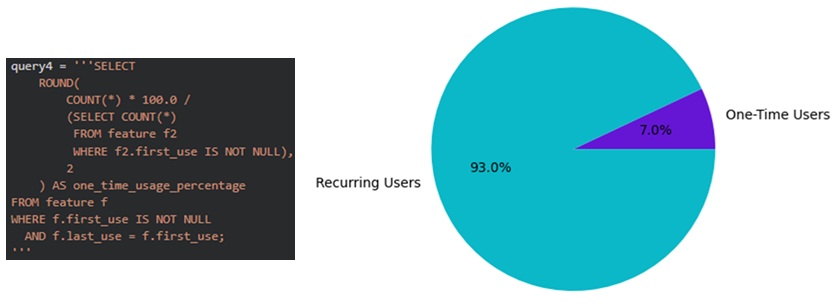
Now imagine the marketing team wants to understand user behavior more deeply: specifically, what percentage of users who adopted the feature are professional designers, and what percentage tried the feature only once (i.e., cases where first_use = last_use). To answer these questions, we can run the following queries and create corresponding charts:
First for the percentage or new feature adopter who are professionals:

Now for the percentage or new feature adopters who only used the feature once:
Analyzing Age Differences Between Early and Late Feature Adopters
The marketing team believes that early adopters tend to be younger and is considering a campaign focused on users aged 25–40. As part of the data team, we can support this with evidence so they can make a data-informed decision. First, we use Python to create a new column that classifies users as “no adopters,” “early adopters” (those who started using the new tool before 2025-02-01), and “late adopters.” With this classification in place, we can then write SQL queries to compare the average age of early and late adopters.
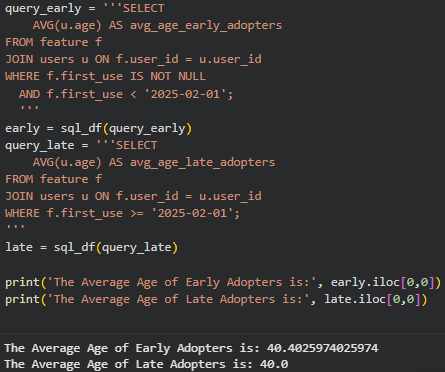
With this we can prove that there is no age difference between early and late adopters.
There may be additional patterns in this data that aren’t immediately visible, so to explore whether there are other business questions we should be asking, we’ll divide our customers into groups using a well-known clustering approach.
There may be additional patterns in the data that aren’t immediately visible, so to uncover potential new business insights, we’ll group customers using a well-known clustering method.
Customer Segmentation with K-means
Sometimes there are patterns in customer behavior that are not immediately obvious, so separating users into clusters can be a great way to uncover insights and design business solutions that respect the particularities of each group. The K-means algorithm is extremely helpful for this, and in this post, as a quick demonstration, we created a new dataframe with age, country, subscription plan, professional status, and adoption type (no, early, or late). We converted the categorical variables using get_dummies and applied StandardScaler to the numerical ones. With 4 clusters, these are the results:
Cluster 0: Younger users with mixed professional backgrounds, moderate adoption, and balanced subscription plans.
Cluster 1: Older, mostly non-professional users with low engagement and low feature adoption.
Cluster 2: Highly engaged professional users, strong early-adoption behavior, and concentrated in premium plans.
Cluster 3: Mixed-age users with late-adoption patterns, mostly from mid-tier plans and specific countries.
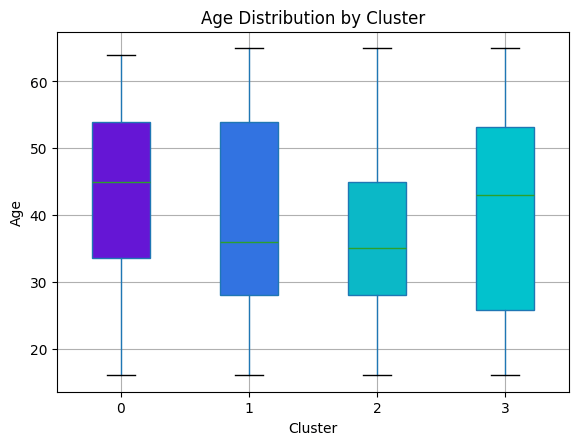

These results show that there is a high level of homogeneity between customers, which leads the cluster to have some particularities, but not drastic differences. Testing different numbers of cluster, and using the Elbow Curve Method to determine the optimal number of clusters would be recommended.
Conclusion
Combining Python with SQL gives us the best of both worlds: SQL provides a fast and flexible way to extract, filter, and aggregate data directly from the source, while Python offers powerful tools for visualization, statistical analysis, and machine learning. By integrating both, we can move seamlessly from data collection to deeper insights and predictive modeling, creating a complete and efficient analytics workflow that supports stronger, data-driven decisions

Leave a comment